How I actually ship cTrader indicators with AI
Five steps: spec, first build, debug, optimization, publication. AI compresses the process 2-3x, not 10x. Here's where the time actually goes
// body
If you've ever built something custom for a trading platform, you know it's not really about the code. The code is maybe 15% of the time. The rest is everything around it — knowing what to build, debugging the gap between "compiles" and "works," and squeezing the result down to something that doesn't lag a live chart.
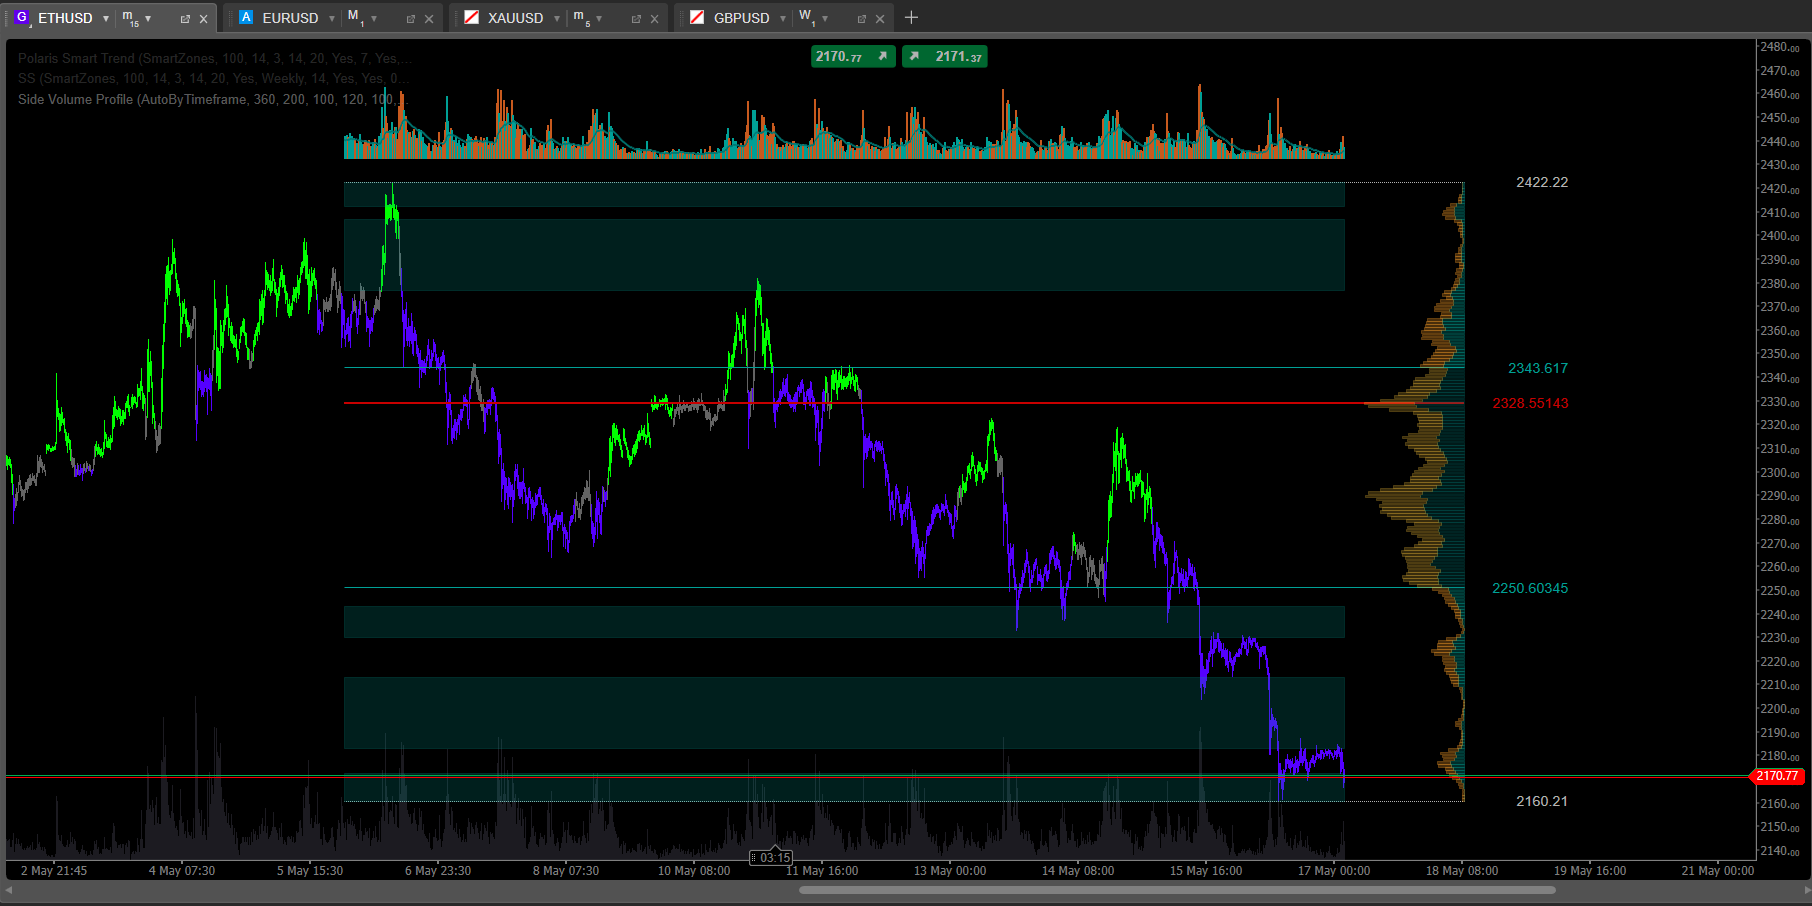
This is how that process actually goes for me, using the latest indicator I shipped — a horizontal volume profile for cTrader — as the running example.
Step 1 — the spec
This is the most important step, and it has nothing to do with code. This is what goes into your head before you ever open a chat with the AI.
Minimum you need to know upfront:
What the indicator does. Not "shows volume," but concretely: "builds a horizontal volume histogram for the last N candles, highlights HVN, LVN, POC, draws VAH and VAL lines"
What's configurable. Period (200 candles? 4 hours? 1 day?), volume source (tick volume vs minute volume — in cTrader these are different), Value Area threshold (70%? 68%?)
What it looks like on the chart. On the side? Overlaid? Transparent? Color gradient by density? Lines — solid or dashed?
Update behavior. Recalculate on every tick? Only on candle close? Only when settings change?
Edge cases. What does it do on the first tick after the chart opens? When the timeframe changes? When N is larger than available history?
This is the specification. Without it, any AI output will be "kind of what I wanted, but."
Step 2 — first build
I hand the spec to the AI. It writes the C# code. I build it in Visual Studio. If it doesn't compile, I send the error back, the AI fixes it, repeat. Usually 2-3 iterations to get a clean build.
When it builds, I load it into cTrader and open a chart.
This is where it gets interesting. Because code that compiles ≠ indicator that works.
Classic problems on the first build:
Profile draws, but bars are inverted on the Y axis — volume shows upside down
Recalculation happens on every tick, so the chart starts to lag during high volatility
POC is correct for the whole period, but VAH and VAL are off by one because of an off-by-one in the loop
Zone colors are picked by a threshold the AI chose on its own (because I didn't specify), and the result is bad — HVN and LVN aren't visually distinguishable
Indicator draws fine, but disappears when the timeframe changes and doesn't repopulate
The AI doesn't see any of these. From its perspective, the code compiled. Job done.
Step 3 — the debug loop
This is the longest step. On average it eats 3-5x more time than the spec and first build combined.
It looks like this:
Me: "Profile is inverted. Highest volume is at the bottom, lowest at the top. Should be the other way."
AI: "Flipping the loop order."
new build
Me: "Order is right now, but VAH and VAL are one candle high."
AI: "Fixing off-by-one in the Value Area calculation."
new build
Me: "VAH is correct. VAL is still off. Look at CalculateValueArea — the loop runs from POC down inclusively, but the exit condition triggers one step early."
AI: "Right, here's the fix..."
Dozens of iterations. Every fix is a moment where you see the bug and the AI doesn't. You point at the function, the loop, the parameter. The AI fixes.
The most infuriating part is when the AI "fixes" one thing and breaks another. Fixed the off-by-one → broke the edge case when N exceeds history length. Fixed that → introduced a null reference in the update method. Classic regression. The only way to catch it is testing every iteration, manually.
Step 4 — optimization
When the indicator is finally correct, optimization starts.
A cTrader indicator runs in real time. If your code is slow, the chart lags on every tick. On EUR/USD during the London session, that's 10-50 ticks per second. Any O(n) operation in the Calculate() method that could be done incrementally — that's a brake on the entire chart.
Typical optimizations at this stage:
Caching aggregates. Don't recalculate the whole profile on every tick — update only the affected bin
Avoiding allocations. Replace
new List<double>()insideCalculate()with a class-level bufferLINQ → loops in hot paths. LINQ is pretty. It's also slower. In the inner loop, raw loops win
Early returns. If nothing changed since the last call — don't recalculate
Each of these is a separate conversation with the AI, a separate iteration, separate testing to confirm nothing else broke.
Step 5 — publication
Only now is the indicator actually ready. In my case — publication to the cTrader Algorithmic Trading Marketplace.
Between "first build compiled" and "indicator published," it's typically 2-4 weeks of work for me. Of that, the coding itself is maybe 10-15%. The rest is debug, manual testing on live charts, optimization, edge cases.
What you should actually take from this
AI compresses Step 1 from weeks to days (writing the C# scaffolding) and Step 2 from days to hours (compilation, syntax, plumbing).
AI doesn't compress Step 3 (spec-driven debugging) and only partially compresses Step 4 (optimization, where expert eyes on the code are still required).
End to end, from idea to published indicator, AI speeds my process up by about 2-3x, not 10x. And that speedup only happens for someone who already has the expertise. Without the expertise, you just arrive at a non-functional result faster.
AI doesn't do the work for you. It speeds you up — if you already have somewhere to be going.